The following text was first published on March 26, 2025 as a LinkedIn article.
What started as a simple thought — “How do I assess the actual threat level in these current geopolitically unstable times?” — quickly evolved into a deeply practical project: a lightweight threat assessment tool that mixes geopolitics, civic awareness, and a bit of creative automation. It’s 100% built with free tools (except for ChatGPT Plus, which I used to support the co-coding and planning stages), minimal code, and a real sense of urgency.
I live in Helsinki, Finland — a country that shares a 1,340 km border with Russia. As a father, with a background in humanities and technology enthusiast with deep concerns for both human and animal rights as well as the environment, I felt the need to understand how global tensions — from the war in Ukraine to environmental destruction — might ripple down into my immediate civic reality.
So I built a tool.
The most dangerous thing about a looming threat is pretending it’s not there.— Unknown
What I Built and How It Works
A simple yet insightful tool I call Threat Assessment Dashboard that monitors five key domains:
- Geopolitical Tension – Tracks developments related to international security, military movements, diplomatic crises, and cross-border threats that may impact Finland’s position or safety.
- Information Environment – Monitors the flow of disinformation, fake news, cyber campaigns, and propaganda that could destabilise public trust or manipulate civic discourse.
- Civic Infrastructure – Assesses risks to core systems like electricity, transport, water, and communications — essential services that support everyday life.
- Social Stability – Keeps an eye on public unrest, strikes, protests, and signs of societal polarisation or fragmentation.
- Environmental Threats – Evaluates short- and long-term ecological factors such as pollution alerts, extreme weather, and biodiversity stressors that affect regional sustainability.

Each domain is scored daily on a 1–5 scale, based on keyword matching from trusted, transparent RSS news sources (e.g. YLE, Euronews, EUvsDisinfo, HELCOM). All data is logged and emailed as a weekly digest.
- 🟩 Built in Google Sheets + Apps Script
- 🧠 Keyword-based matching on live RSS feeds
- 🔐 GDPR-safe form-based subscription
- 📨 Subscribers receive a weekly digest every Monday at 07:00
- 💬 Plain language summaries & transparency about data sources
No backend, no external hosting. Just a smart sheet and a bit of glue code.
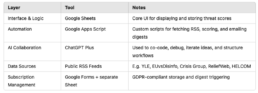
What I Used (Tech Stack Overview)
Who This Is For
This isn’t just a spreadsheet project. It’s a prototype for:
- 📚 Scenario-based learning activities
- 🌐 Smart overlays in XR environments
- 🎓 Teaching data awareness & resilience
If you work with AI, automation, education, or civic tech, you’ll see how this can flex and scale.
Working with AI (and a nod to Claude)
Throughout this project, I collaborated extensively with ChatGPT to co-code, debug, iterate logic, and reshape the dashboard’s structure in real-time. This wasn’t my first time working with an AI as a creative partner — I previously collaborated with Claude which resulted in a published paper titled “Pushing the Boundaries”, where I explored what happens when you pair human context with machine insight.
In both projects, the back-and-forth between structured thinking and creative problem solving made the AI feel more like a thinking partner than a tool.

Lessons Learned from Co-Coding
Building this tool was also a real-world exercise in iterative problem-solving. Some key lessons that stood out:
- RSS feeds break — a lot. URLs get deprecated, formats change, or feeds simply disappear. I had to test, discard, and replace several sources mid-way. A few seemingly reliable outlets had no usable feeds at all.
- Local relevance matters. International feeds are informative, but truly local context requires national or even regional media — often with limited tech infrastructure. Balancing quality with specificity was a daily challenge.
- Iteration is everything. We started with one domain, one script. Then added structure, source transparency, and scoring logic step by step. Each round improved usability and accuracy.
- Naming things is hard. And yes, it turns out consistency matters when you’re juggling multiple scripts, sheets, and automation triggers.

Some of the most interesting (and frustrating) moments came from trying to integrate sources that would have significantly improved the dashboard’s fidelity:
- SUPO (Finnish Security Intelligence Service) – Highly relevant for geopolitical alerts, but no public feed or structured access.
- Estonian Foreign Intelligence Service (EFIS) – Offers great intelligence reports, but again, no RSS or automated entry points.
- Fingrid – A goldmine for infrastructure status in Finland, but hard to tap into programmatically.
- NordPool – While critical to understanding regional energy markets, their site structure isn’t feed- or bot-friendly.
- City of Helsinki & HSY – They publish useful local updates, but access is inconsistent or locked behind modern website platforms that don’t expose their content in ways easily readable by code (like RSS or APIs).
- Traficom / National Cyber Security Centre (CERT-FI) – Sends out valuable vulnerability bulletins via email; may offer a structured way to access updates programmatically.
- Helen (Helsinki Energy) – A major player in local infrastructure whose updates could enrich civic monitoring.
- F-Secure (and other national/international cybersecurity firms) – I’d like to explore whether they provide public RSS feeds or news endpoints that could be parsed for relevant threat data.

These attempts highlighted just how fragile and fragmented public data ecosystems can be — even in countries with strong digital infrastructure. If anything, they reinforced the value of open standards and public APIs.
If you’re thinking about building a lightweight civic dashboard, I highly recommend doing it live, incrementally, and with room for surprises. That’s where the real learning happens.

Digging Deeper: Authoritarian Signals & Grassroots Intel
As the project matured, I found myself asking: could we gain early insight into geopolitical tension by monitoring legislative signals from countries like Russia or China—or by following grassroots sources like Telegram channels and OSINT accounts?
This was purely a thought experiment. We didn’t integrate anything, but we did look into whether public feeds or update channels even existed for bodies like the Russian Duma or China’s National People’s Congress. That exploration helped frame how useful such signals might be in principle.
Even without direct access, several indirect sources could potentially offer valuable early-warning cues:
- Filtered state media feeds — like TASS or Xinhua — sometimes echo or pre-announce decisions.
- Watchdog organisations — such as Russia Matters or China Digital Times — provide expert interpretations of legislative moves.
- Telegram channels and Russian military bloggers — While not RSS-compatible, some channels post daily updates ahead of traditional media. These include insights on troop movement, mobilisation, and national sentiment.
Integrating Telegram data would require bridging tools and strong vetting protocols. Still, grassroots sources—if curated well—offer immediacy and nuance, especially when official narratives become more controlled. Legislative actions often precede major geopolitical shifts, and tracking them through trusted intermediaries could add a predictive layer to future versions of this dashboard. Integrating these would require bridging Telegram to RSS via third-party services, and careful vetting to ensure accuracy.
Grassroots insights from unofficial voices offer texture and immediacy, though they require stronger curation and verification mechanisms. Still, they may become an important part of future dashboard versions, especially as state-controlled media tightens control over official narratives. Legislative actions often precede larger diplomatic or military movements, and tracking them through reliable intermediaries (and keyword filtering) adds a predictive layer to the threat dashboard.

Help Me Improve It
This proof of concept was always meant to be broad — a global, generalised dashboard to explore what’s technically possible with minimal resources. Now that this has been validated, and considering the existence of much more advanced international tools (eg. ReliefWeb (by UN OCHA), ESRI Disaster Response Program or START Global Terrorism Database (GTD)) dedicated to threat monitoring, I’d rather focus on developing a more targeted local version tailored to Finland.
To do that, I’m looking for input. If you know of reliable Finnish RSS feeds (Swedish and Estonian ones are fine too), organisations, or datasets that could improve monitoring across the five domains — especially Social Stability, Infrastructure, or Environmental Threats — I’d love your suggestions; maybe even collab?
Final Thought
Sometimes, building a small, purpose-driven tool is the best antidote to feeling overwhelmed. And sometimes, the best collaborator is an AI who never complains about your naming conventions 😉
All images are by Sasa Tkalcan (me), no AI used!
[…] through iterative coding dialogues and handled the surrounding implementation steps myself, see Threat assessment monitoring tool and Pulling YouTube scripts . Here, the intention was to see how far the system could carry the […]